


F1 Insight
5 Mar 2023 • 5 MIN READ
Project type
Web Application
Year
2022
Roles
Designer, Developer
Tools and technologies
Next.js, TypeScript, Tailwind, nivo, Ergast API, cheerio, Figma
In a nutshell
F1 Insight is a visual analytics web application, where you can see race results, driver results, team results, and driver/teams standings of the current Formula 1 season. By showing the results of all races using graphs, F1 Insight makes it easy to find trends in the data, something that would be very tedious and non-trivial otherwise by inspecting isolated race results.
The idea
I’ve always been a Formula 1 fan, but in 2018 something clicked, and I became very geeky about it, never missing a qualifying session or a Sunday race. One of my favorite things is to look at the updated driver and constructor standings after each race, to see any changes from weekend to weekend.
However, trying to find trends and possible soon-to-happen rank swaps is tedious when looking at tables on the official Formula 1 website, and at some point I began fantasizing about creating a platform that would make it easy for me (and other people) to geek out about this sport.
My idea was simple, I wanted to make it super easy for people to quickly get access to at least the following information:
- Qualifying and race results
- Driver and constructor standings
- Driver information (e.g. age, date of birth, place of birth) and results over the entire season
- Constructor information (e.g. headquarters, team principal) and results over the entire season
The design process
After I had a clear idea of the kind of product I wanted to build, I began to reason how all the information I wanted to display could be grouped together, and I thought that the best way was to create 4 pages:
- Race results (located at
/races
) - Drivers (located at
/drivers
) - Teams (located at
/teams
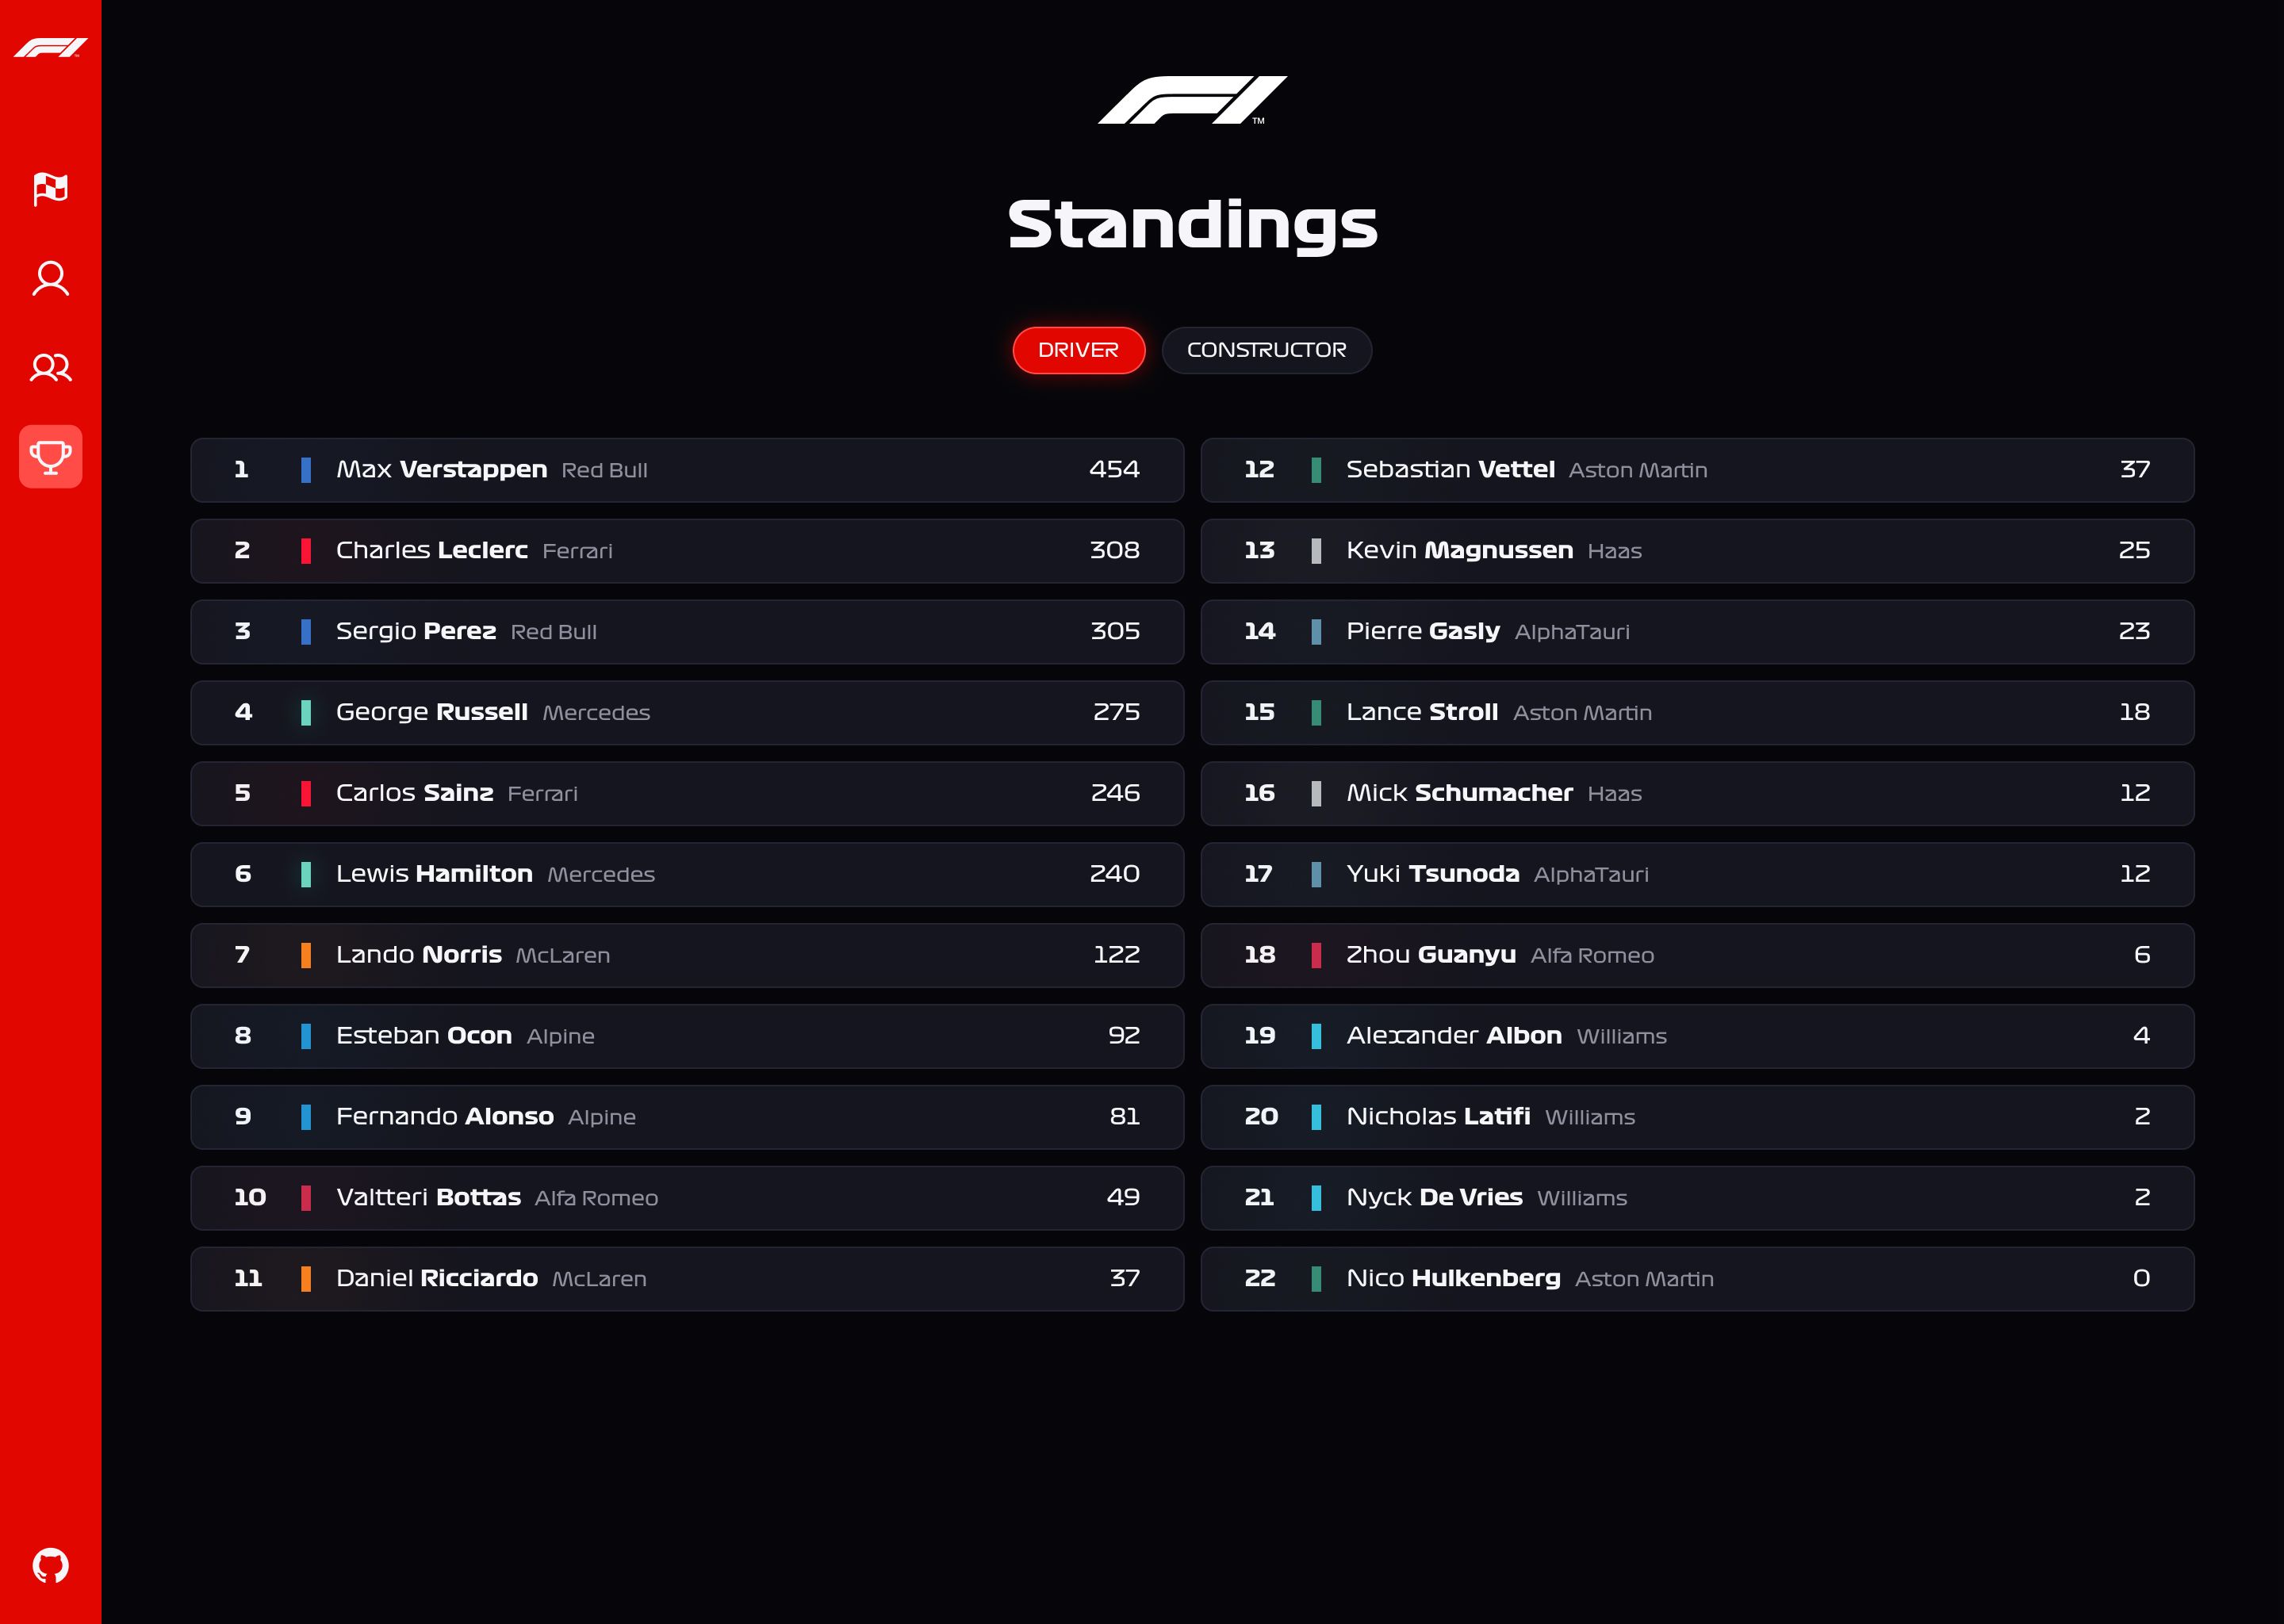
) - Standings (located at
/standings
)
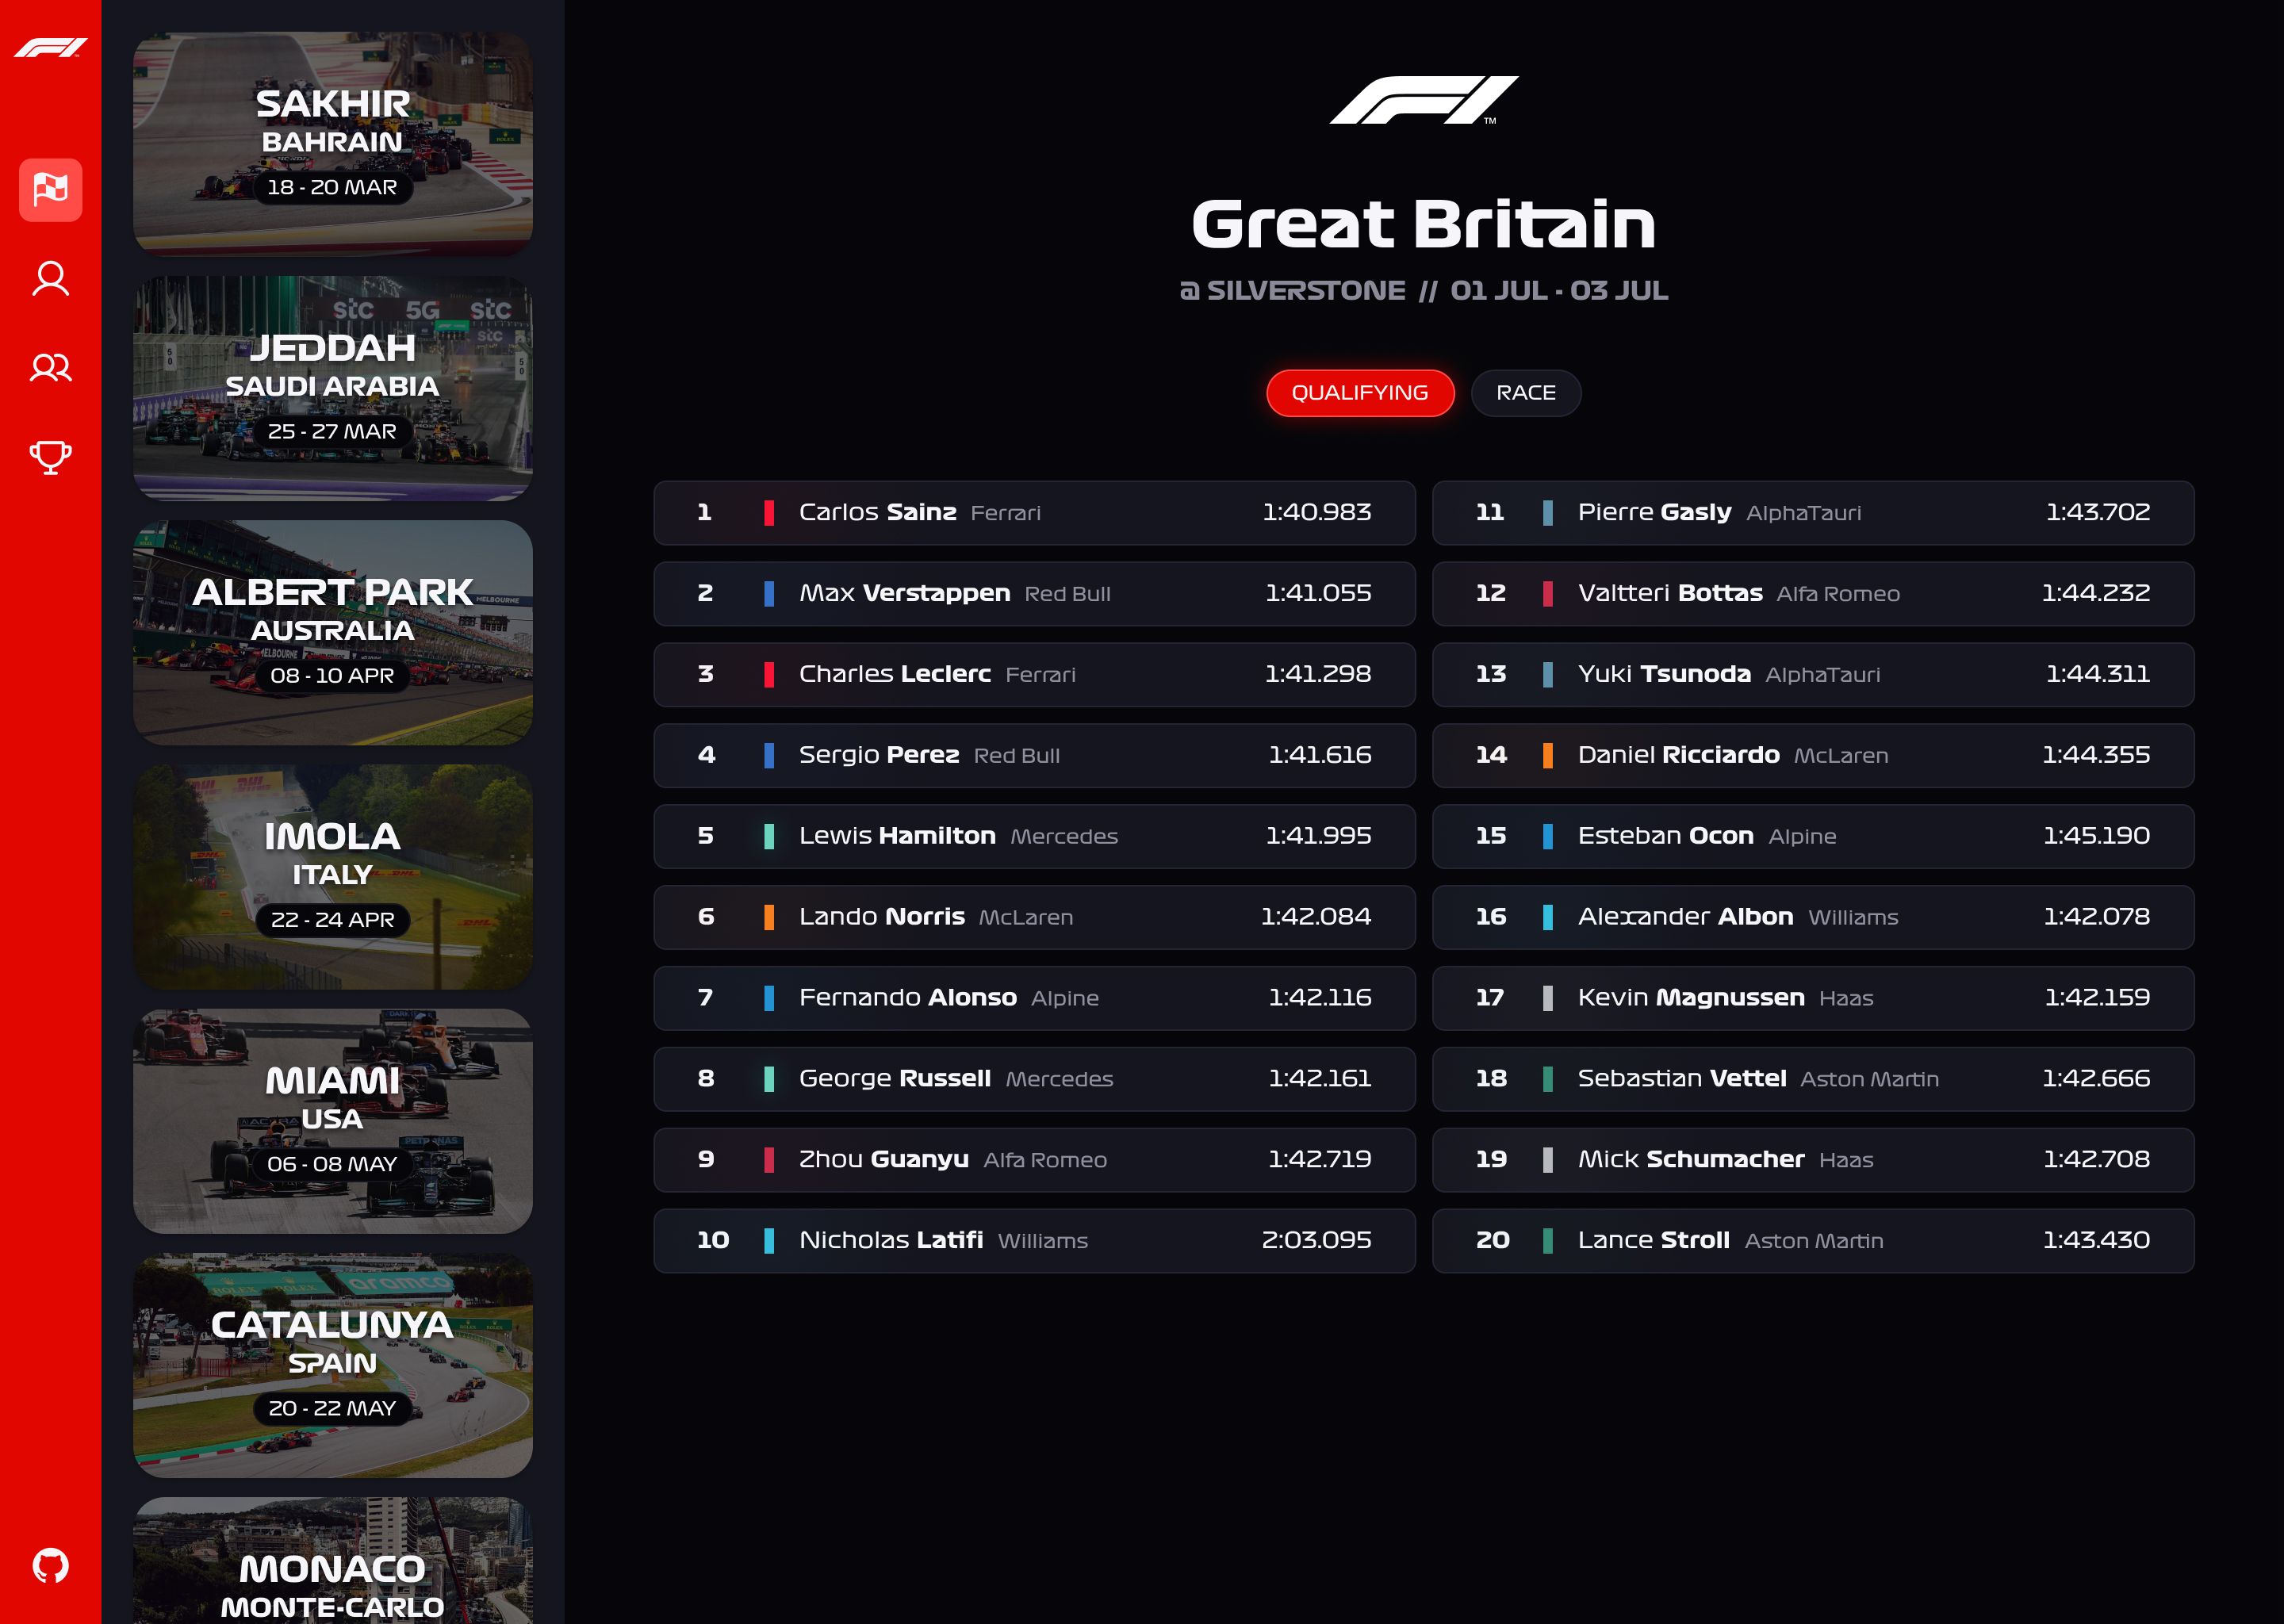
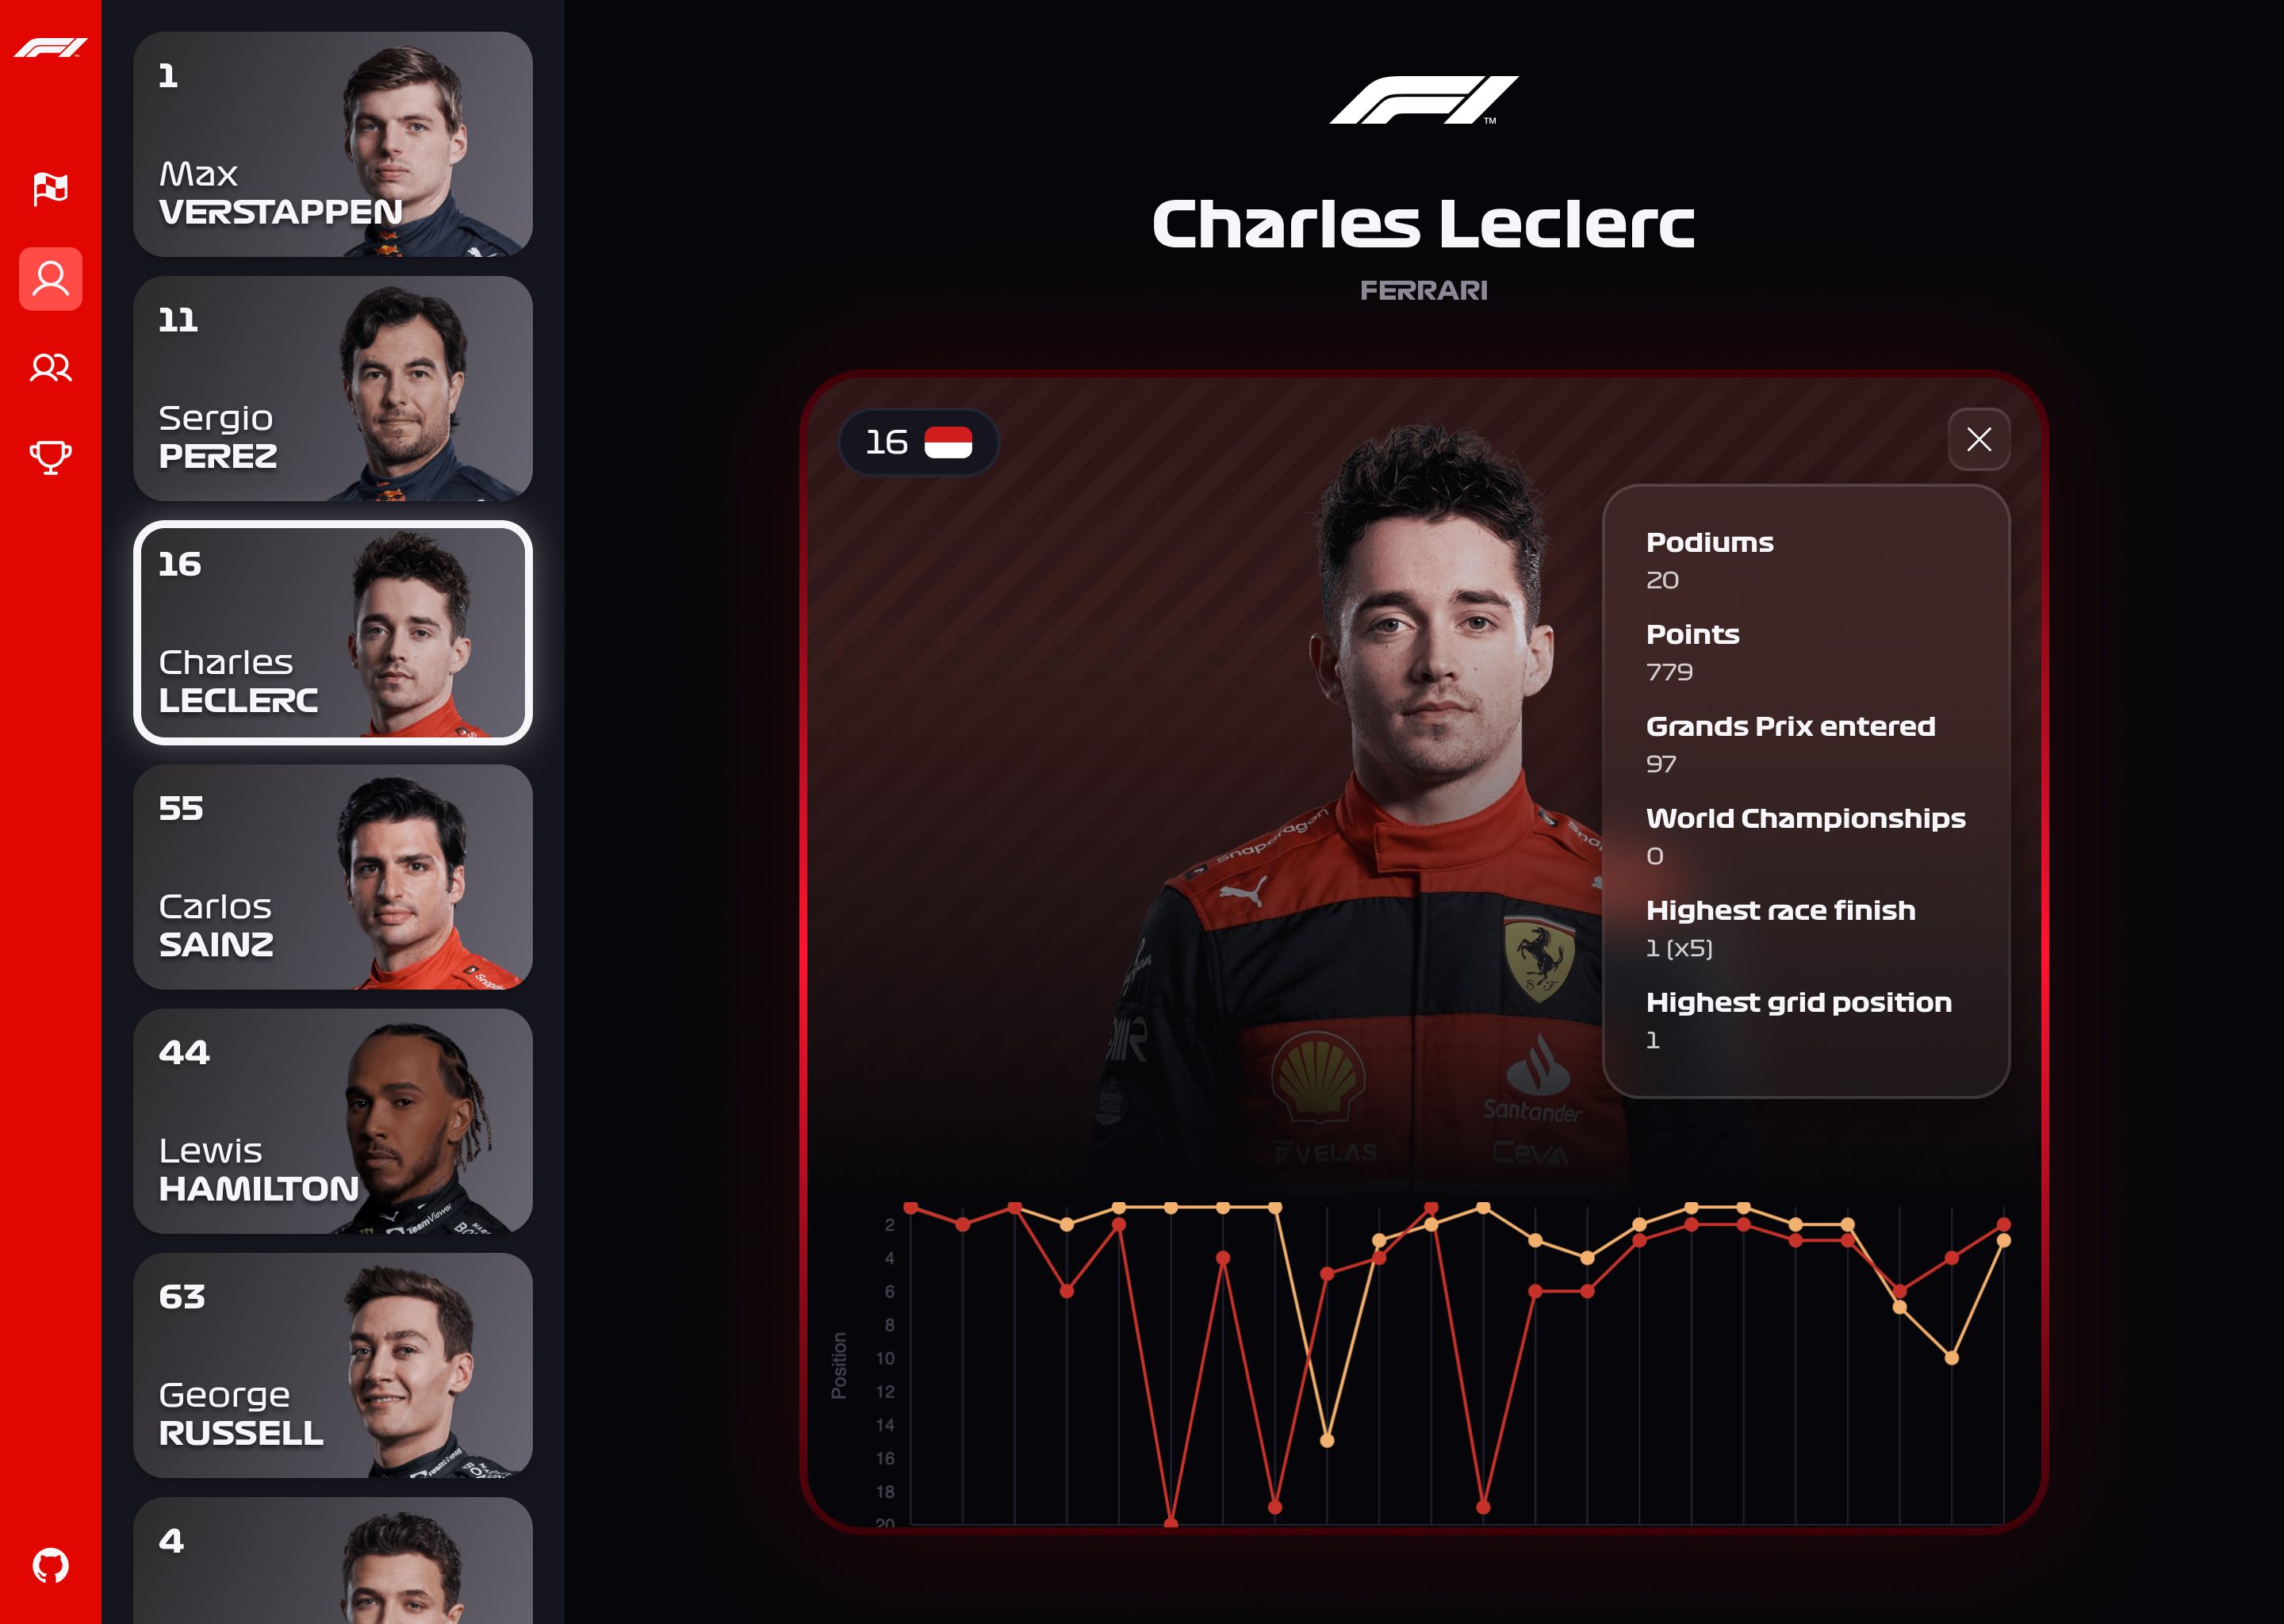
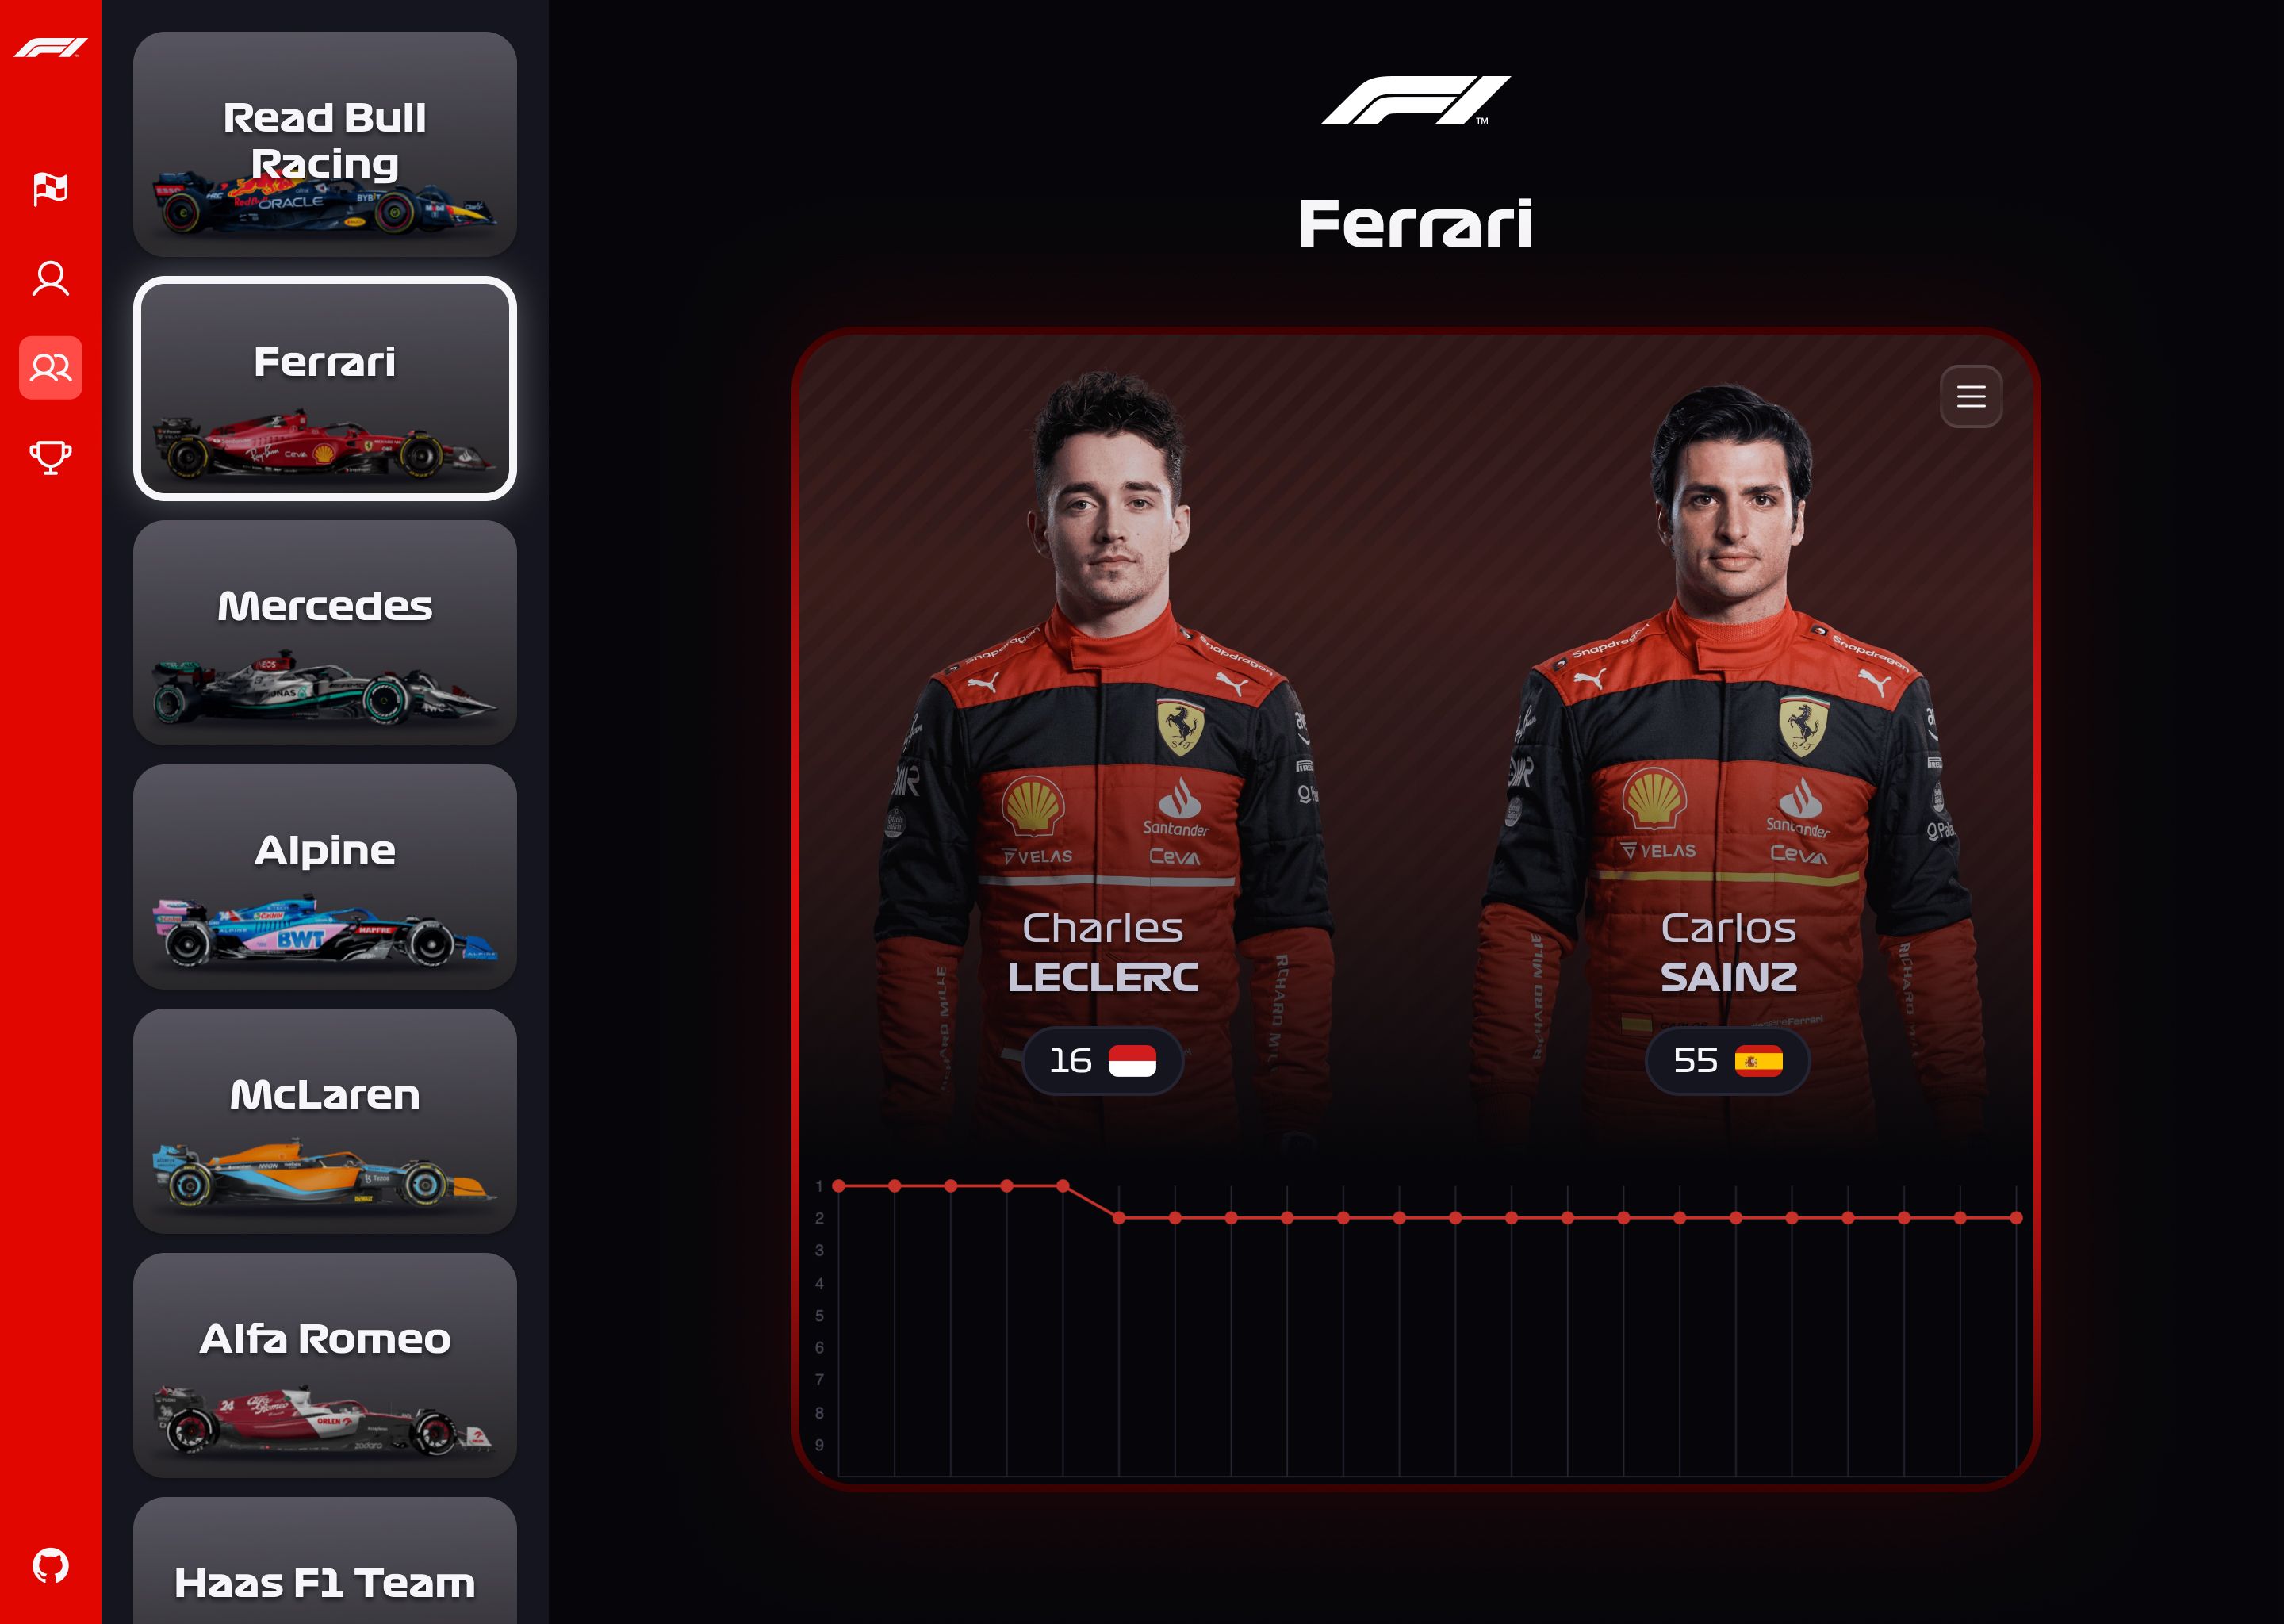
The race results page (see Figure 1) would have had the qualifying and race results of each grand-prix, with the respective final grid order and at least the lap time each driver. The drivers page (see Figure 2) would have had for each driver, a big image along with a few personal information, and the progression of the results over the entire season in the form of a graph. The teams page (see Figure 3) would have been very identical to the drivers one, but with the image of both team’s drivers instead of just one. Finally, the standings page (see Figure 4) would have showed the current driver and constructors standings.
With all that, I created mockups for each page and I moved to the development phase.
The development journey
The development of F1 Insight actually didn’t start in 2022, but rather in 2020 right after I got my Computer Science bachelor’s degree. At the time, I knew React well, but I felt behind in terms of tooling. I was still using plain JavaScript and Create React App, and I wanted to learn something new, so I decided to use this project as an opportunity to learn TypeScript. I absolutely loved how easy it was to find errors early, and how convenient it was to use types to specify components props. That summer I went as far as creating almost all pages, but then September came, I started a master’s degree at uni and I had to stop the development for lack of time.
Between 2020 and 2022 many things have changed in the JavaScript ecosystem, such that when I was about to get my master’s degree, I took a look at the F1 Insight codebase and I just knew that I had to start over. Not because the code was necessarily bad, but because too many libraries, as well as the React world itself had changed too much and there were now just better options in general.
So I decided to start the development phase from scratch, and to pick a better suite of tools. In the end, I chose the following tech stack:
- TypeScript: the main high-level programming language
- Next.js (NEW - replaced Create React App): the rendering framework
- Tailwind (NEW - replaced styled-components): for styling
- nivo: to create the graphs
- Ergast API: to fetch the Formula 1 data
- cheerio (NEW): to scrape data from the web
The biggest changes between the 2020 and the 2022 versions are Next.js and Tailwind. Next.js is arguably a better choice than Create React App, because of its compilation speed (Rust to the rescue), built-in router, multiple rendering strategies, API routes and other smaller (but very appreciated) features like built-in optimizations for images, fonts and scripts. On the other hand, Tailwind replaced styled-components (which I still like), because in the last year I have been preferring other options that make it easier to create variants and multiple themes, like cva.
Scraping the web
One of few core features that in 2020 I hadn’t implemented yet, were the drivers and teams info-boxes that are visible in Figure 2. They look quite simple, but the problem is that that there is no way to get the data they need from the Ergast API (the REST API I use to get the Formula 1 data). Or rather, some information could technically be possible to retrieve, but it would require an insane amount of API calls to do some local computation (more on that in the next section…). For that reason, I figured that the easiest and most convenient way was to directly scrape Wikipedia with cheerio. This process was not too hard, but I had to do a lot of data cleaning, because almost every page had a slightly different HTML structure and data shapes.
I got rate limited…
Before I had even started coding the application in 2020, I looked around to find some web APIs that would allow me to fetch the Formula 1 data I needed. I found several paid subscription-based APIs, but I didn’t want to spend any money since it was just a fun side-project. Luckily, I found a pretty nice and free REST API called Ergast.
By using the Ergast API I was able to fetch all the data I needed to implement all the features I had planned. However, after a while I started to notice that from time to time - apparently for no reason - I was unable to fetch any data. I soon discovered that that was happening… because I got rate limited!
When I found that out I felt so dumb, because for most pages I needed to make at least 20 API calls (at least one for each grand prix, driver and team) at every request to the server, and it was clearly written in their terms and conditions that “you must not create any application which polls the API more than four times per second or more than 200 times per hour. Applications and users exceeding these rates are likely to be blocked. Caching is permitted and encouraged”.
The way I wrote the code was meant to generate as much static code as possible and to make as few API calls as possible in production. However, in development Next.js treats the static site generation process just like server-side rendering, which is why I ended up getting rate limited and almost being unable to work on it locally.
Hence, I immediately started to sketch out possible ways to not throw away the entire app just for this little slip. After doing some digging on their website, I found out that every time the Ergast maintainers update the API, they also upload the corresponding updated database image, which is free to use. So the plan is to download their DB image, host my own DB instance in the cloud and rework my query layer, so that the app is able to continue to get the same data it was previously expecting.
Related posts.

It's been a long road, but I'm so excited to finally be able to share the latest (2022) version of my portfolio with the world!
An open-source NPM package to easily create reveal on scroll animations in Svelte with first-class TypeScript support and near zero configuration.
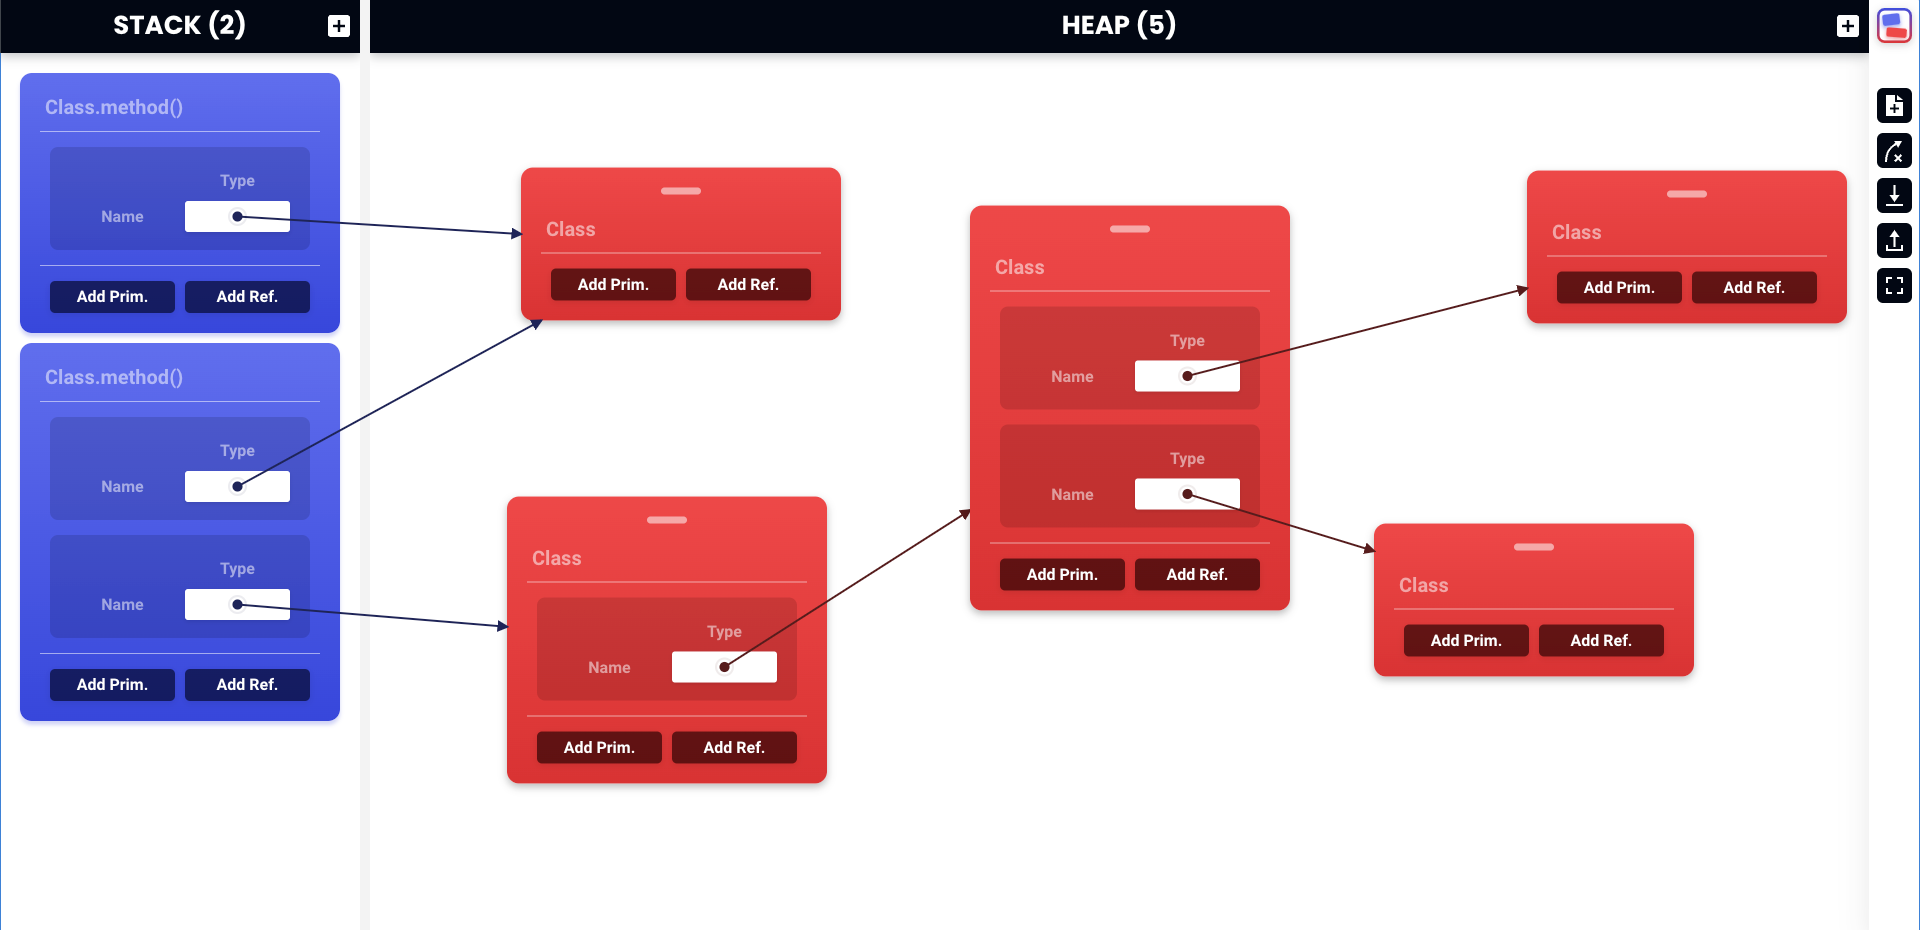
An interactive web application to easily create and manipulate stack and heap diagrams in the context of a university programming fundamentals course.
An open-source Chrome extension to save your favorite fonts from a list of supported websites (including Google Fonts and Adobe Fonts), so you never forget they exist.